|
We will use a mathematical problem-solving template as we work on this geometric modeling exercise in class and the diagram below.
|
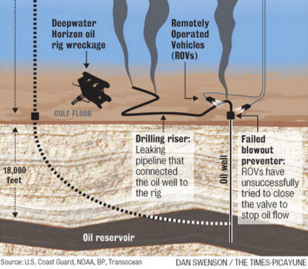
On April 20, 2010 an explosion occurred on the BP owned Deepwater Horizon oil rig in the Gulf of Mexico killing 11 people and setting off the largest accidental marine oil spill in history.
On May 11, 2010 the footage to the left was released. At that time, the official estimate of the oil spill rate was 5000 barrels a day. Many scientists, however, were deeply skeptical of those official estimates believing that the flow rate could potentially be much much higher. Steven Wereley, an associate professor of mechanical engineering at Purdue University, was once such scientist. He used the video and a simple geometric model of the pipe to reach an estimate of 70,000 barrels a day, not accounting for methane release. How might he have done this? What would you need to get from the video to recreate his work? Did you come up with a model?
If you have and know what else you need to know from the video, click here to find that. If you are stuck, you can go ahead and click there as well. |
